Early in 2010, deniers were focused on cherry-picking out-of-context quotes from the thousands of emails between climate scientists they cleverly dubbed “Climategate.” Today they cherry-pick graphs showing little or no surface warming. But early in 2010, they wouldn't have dared to show the following graph of the UAH dataset:
The graph shows that over the past (at the time) 26 years (1984–2010), not only had there been statistically very significant global warming of the lower troposphere (about 3.5 km above ground level), it was at an alarming pace of nearly 2 degrees C. per century, with a greater than 95% probability that the true warming trend was somewhere between 0.77 and 2.93 degrees per century.
Nor would they have dared to publicize the even more alarming warming trend since 1992:
“The University of Alabama in Huntsville (UAH) global temperature record, which is satellite-based and therefore uncontaminated by the urban heat island effect and maintained by our trusted colleagues in climate consensus rejection John Christy and Roy Spencer, clearly shows that the planet is warming at a rate of some 2.3 degrees Celsius per century.”
That is not something you would have read on “Watts up with That” or any other climate consensus denial blog, website or media outlet. While Watts and Fox and CFACT et al. were crowing that year about “hide the decline,” the internal memo would have been “hide the climb: do not put up highway billboard memos to Al Gore. This information must be contained!”
That was just two years ago. Evidently something has happened since then to obliterate that formidable warming trend. Let's update that graph using UAH's most recent published data as of June, 2013:
Hmmm....
“It has just come to our attention that, as of today, the lower troposphere – according to the totally reliable UAH temperature record – has been warming since 1992 at a truly alarming pace. If this statistically significant trend continues, by mid-century we can expect to see another 0.75 degrees of global warming – an amount nearly equal to the global warming since the beginning of the 20th century. Al Gore, please disregard our previous memo about a recent stoppage in global warming. We sincerely apologize for any ‘inconvenience.’”
That's another memo you won't see on CFACT billboards.
But you won't hear it from credible climate science sources either, because it would be cherry-picking. I should know because I cherry-picked it myself.
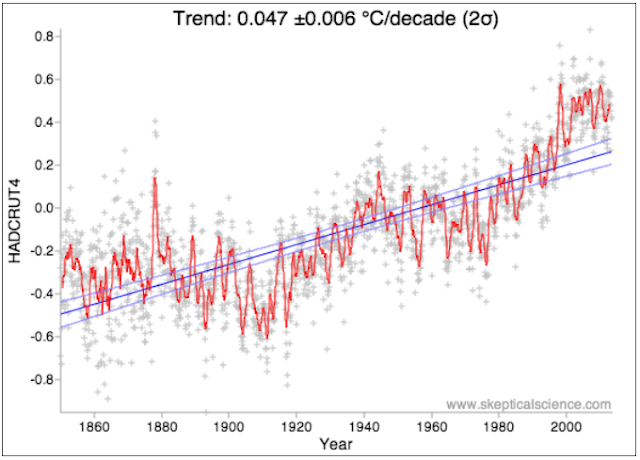
If you use a trend calculator like the one at Skeptical Science or Wood for Trees, you'll quickly discover that very short-term trends (less than 5 or 10 years) are so badly distorted by the ups and downs of the short-term variations in natural climate influences (natural “forcings,” in climatology jargon) such as the sunspot cycle, the El Nino/La Nina heating/cooling cycle and volcanic eruptions, they can give you a warming trend of 10 degrees per century as easily as they can give you a 5-degree cooling trend if you pick the right start and stop years. Just look at the possibilities for picking cherries in this graph of the HadCRUT4 temperature record, which goes all the way back to 1850:
And speaking of cherry-picking, if instead of measuring global warming with what statisticians call linear regression trends (as we've done throughout this post), you compare the average global temperature from one decade to the next, you come up with jaw-dropping evidence that the first decade of this century, far from being a bust as far as global warming was concerned, was the warmest decade in the temperature record, warmer than the torrid 1990s by the biggest decade-to-decade margin ever. That assessment – coming from the World Meteorological Organization, no less – is detailed in a previous post.


No comments:
Post a Comment